Building an AI-powered data explorer
Exploring data should feel natural, like conducting an interview with an expert. However, analysts write their queries in code. It’s easy to get bogged down in syntax errors, forgetting parentheses, typing in complex chart specifications, or messing up variable names.
To reach that natural process of inquiry, I created an AI assistant for exploratory data analysis and prototyping visualizations. Here were my requirements:
- Ask natural language questions and get answers from a dataset.
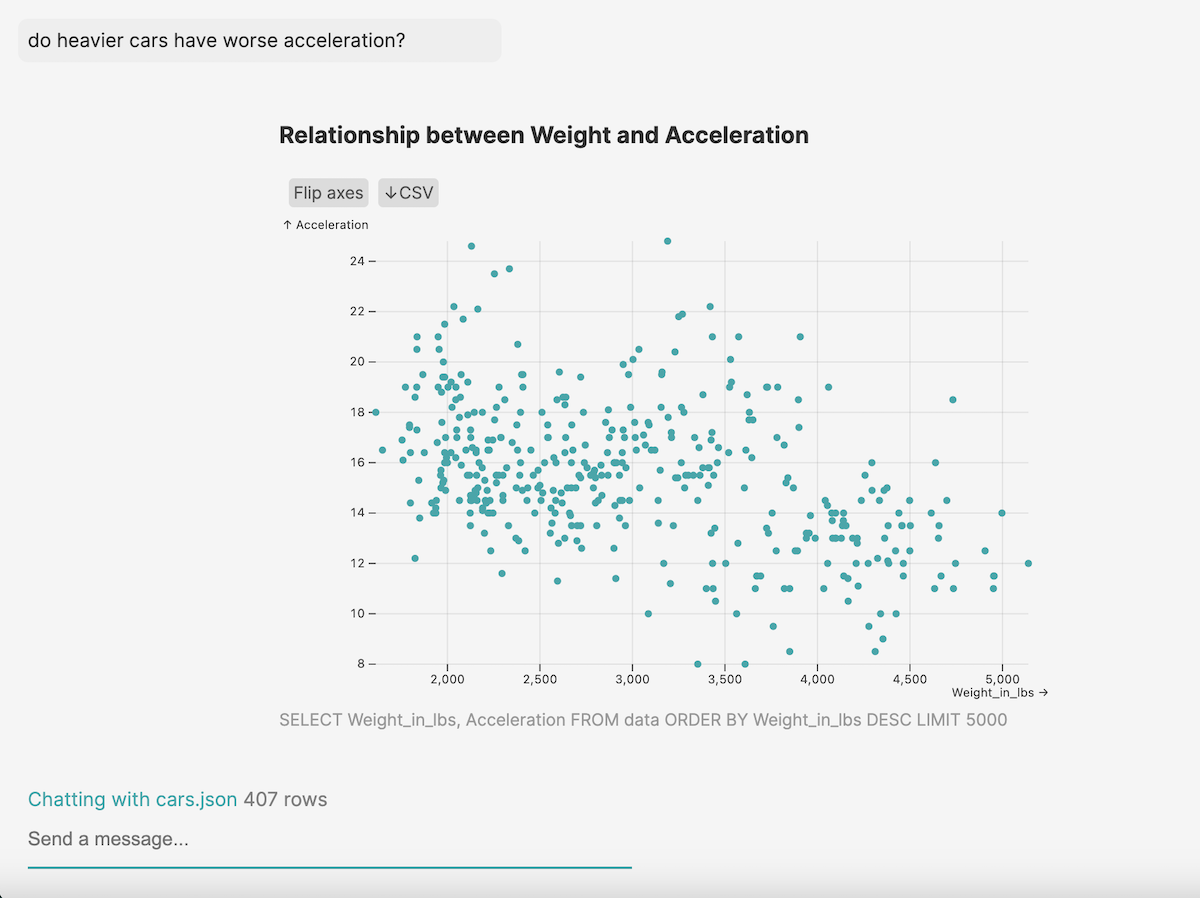
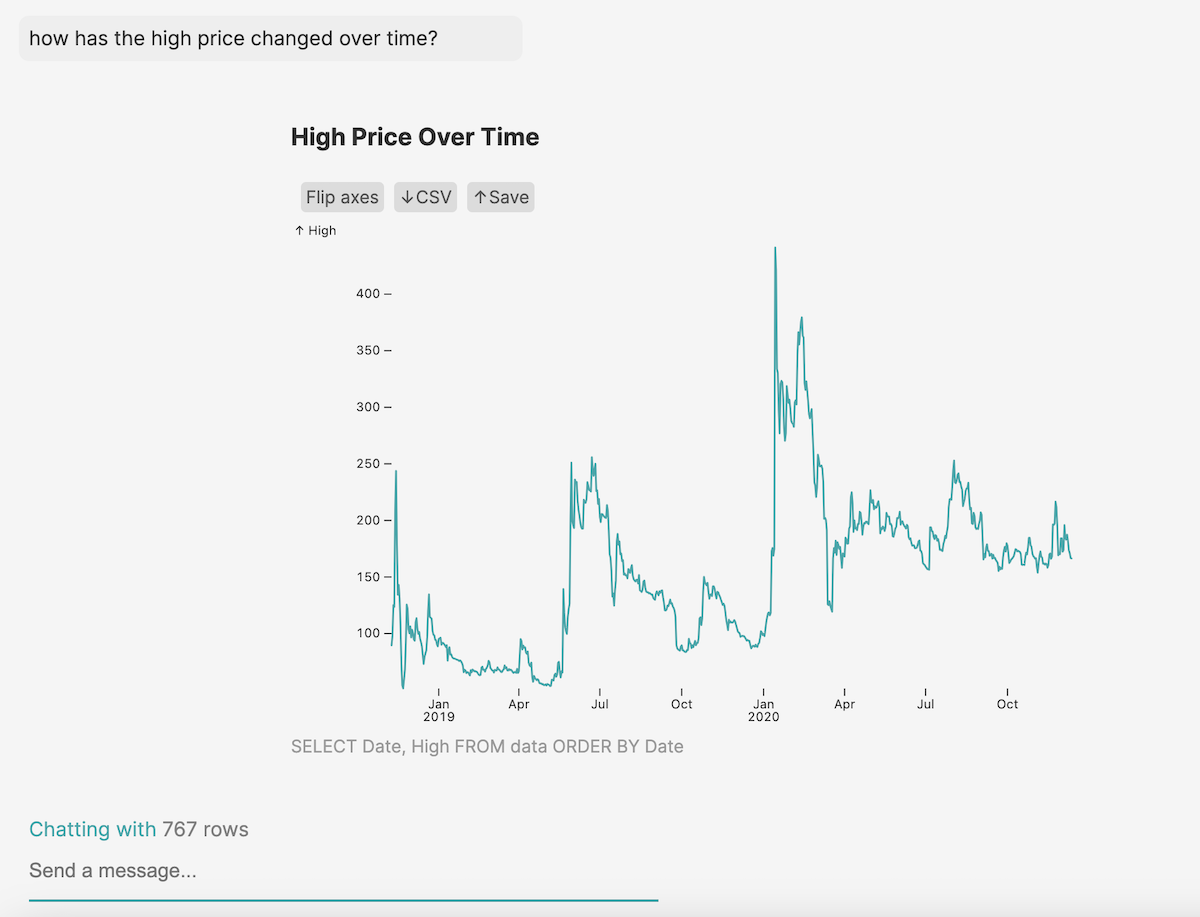
- Return simple visualizations and summary tables based on the questions, without me having to choose the visualizations or code them myself.
I took advantage of Vercel’s AI SDK 3.0, which uses React Server Components to return streamable bits of UI from the AI back to the client. I combined this with Observable Plot, a high-level and flexible chart prototyping library to ask questions and get back charts.
Here's the repo if you want to check out the code, run it locally, or contribute to the project!
In this post, I’ll walk through how I applied a few key AI concepts. Look out for these terms:
- Function calling
- Text-to-sql
- Generative UI
- Structured Output
- Few-shot prompting

Retrieving data from natural language prompts
Essentially there are three steps in what I needed to do:
- Turn a natural language query into a SQL, Javascript or Python expression
- Run it and get back a Javascript array of objects
- Plug that data into the ideal visualization, chosen through a combination of the LLM and hard-coded logical statements
The first step was getting from a regular English question to a code snippet that can return data. Certain LLMs, including recent OpenAI models, can call functions. In the system prompt, you can reference functions that the LLM can use to augment its capabilities.
For example, LLMs are good at text, but bad at math. They only predict the next words in a sequence. So you could give it a “calculator” tool, and tell it to use that every time you need to add.
In my first crude version, I created different functions for different operations on the data. I uploaded JSON files and stored them in memory as Javascript arrays. I used methods from the D3.js library to sort, summarize and filter. I used few-shot prompting to hint at which tool to use, and what parameters to include.
This proved extremely tedious, because I had to write new functions for even simple operations, using Javascript, which is a terrible data analysis language. I needed to make queries specific to clue in the LLM to the right tool for the job.
I figured a much more flexible tool would be text-to-sql. This is an active research area in getting LLMs to take a natural language question and translate it into a syntactically correct SQL query.
Here’s what my data retrieval tool ended up looking like. The name and description fields help the LLM decided when it use the tool. The parameters, which I’ll detail later on, are arguments that the LLM will fill in and pass to a function to execute.
  {
        name: "summarize_data",
        description:
          "Create a summary of the data, grouping one variable by another.",
        parameters:
        ...
  }
In the system prompt, you can instruct the LLM to use it like this:
To use your query to interact with the database, call \`summarize_data\`.
Taking this route meant that I needed a database.
Where to store the data
For this task, I didn’t need to persist the data beyond a single user session. I also just wanted to look at one dataset, or table, at a time. I wanted to stay focused on refining the LLM’s response to prompts and building a seamless generative UI.
So in today’s ecosystem I had a lot of choices.
I tried all of these things
- Just store the data in React state, and use a library like alasql to make SQL-like queries to Javascript arrays
- Store the data on the client using DuckDB-WASM
- Store the data on server in a persistent sqlite3 database file
- Store the data in-memory on the server, using sqlite.
I ended up going with option 4, with the intention of eventually shifting to option 3 so I can save a list of datasets I’m working on. Option 1 provided no opportunity to shift to more persistent storage later.
Option 2 was promising. DuckDB is a newer embedded database that’s supposed to be optimized for data analytics, compared to sqlite. DuckDB-WASM runs in the browser using web assembly. That means you can store all your data client-side and make SQL queries to it.
In fact, another (nice-looking and faster) version of what I did goes this route. You should check this out as well! I used that developer’s open-source React bindings for DuckDB-WASM to load a database in the browser.
But the catch was that I couldn’t access the client-side DB from the server, where all the AI action was happening. Although the chart component renders on the client side, the logic for rendering lives in the server component.
The closest solution I could think of was using React Context to wrap the messages in a provider with the database, and access those from the Chart component. But this would make it difficult to eventually chain queries together - for example to get SQL, then turn that into natural language.
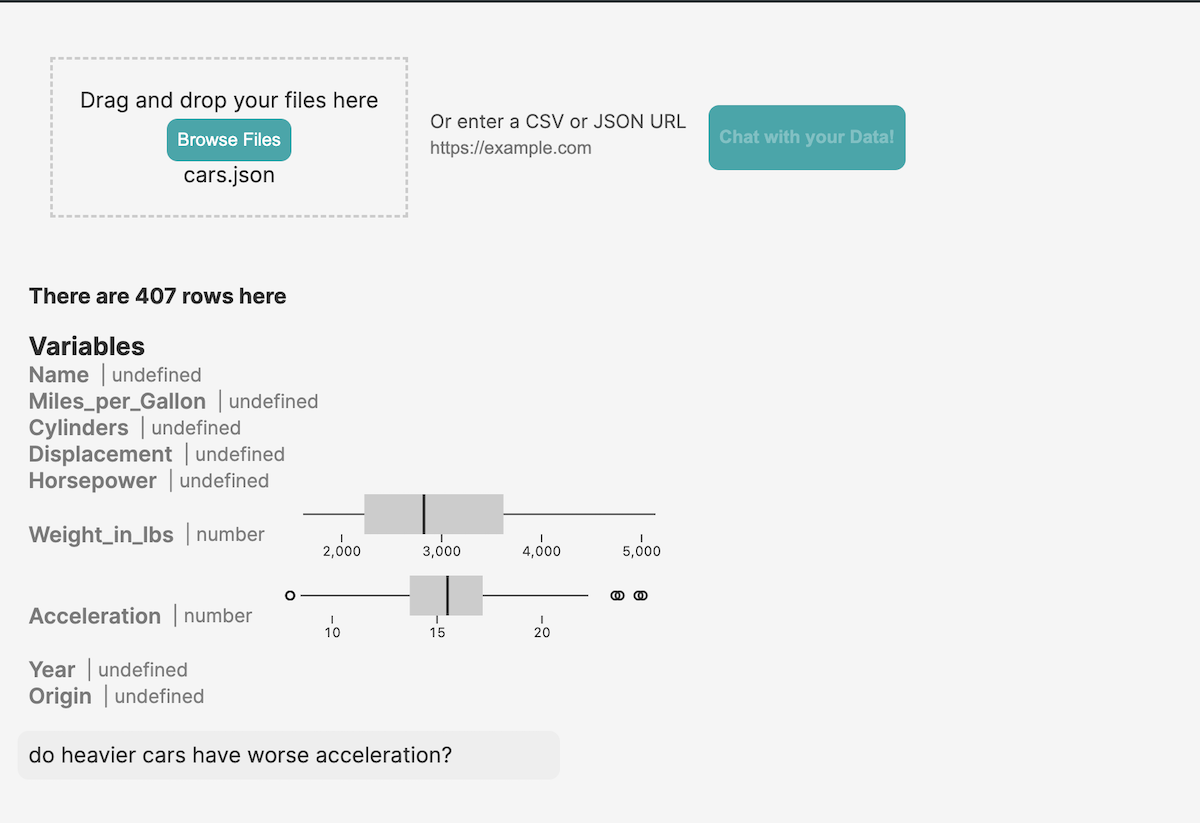
I ended up going with the in-memory sqlite3 database set up on the server using Node sqlite. I used Papaparse to parse CSVs, then some server-side code to extract the schema and other metadata and insert the rows into the db.

The text-to-SQL pipeline greatly reduced the lines of code I needed. I only needed one flexible tool to provide to the LLM.
To ensure success, I included some critical guidance in the system prompt. The LLM is helpless without the database schema. It also helps to include a few sample rows. Think of what a human data analyst does - the first instinct is to check data types and column names, and peek at a few rows.
Vercel AI SDK allows you to track shared variables that are needed on both the client and server in something called the AI state. Normally, this is just an array of messages, but it can be any Javascript object. I modified it to include both a message array and certain metadata, like column names, about the file the user uploaded. The shared state looks like this:
// Define the initial state of the AI. It can be any JSON object.
const initialAIState: {
  sampleData: any[]
  dataKey: string
  columns: string[]
  tableName: string
  schema: string
  topK: number
  dataSummary: any[]
  messages: {
    role: "user" | "assistant" | "system" | "function"
    content: string
    id?: string
    name?: string
  }[]
} = {
  sampleData: [],
  dataKey: "",
  messages: [],
  columns: [],
  tableName: "",
  schema: "",
  topK: 5000,
  dataSummary: [], // this will hold all the data for a short time, then summaries
}
In my database setup function, I store the sample and schema in the shared UI and AI state, and inject these strings into the prompt.
Building a chart from a data summary
After asking a question, getting back SQL from the LLM and running this to retrieve data, I needed to visualize it.
I asked the LLM to generate some encodings (mappings of data to visual variables like color and size) at the same time it created the query. I used the Zod schema-mapping library to coerce its responses into a structured output.
   x: z.string().describe("The x-axis variable."),
              y: z.string().optional().describe("The y-axis variable."),
              size: z
                .string()
                .optional()
                .describe("The variable to be represented by size."),
              color: z.optional(
                z.string().describe("The variable to be represented by color.")
              ),
This way, I could be sure I was getting all the required variables for the chart, in the right format, from the LLM’s choices. These included x, y, color, and size encoding, and a chart title. Similar to a few-shot prompting approach, I included guidance in the system prompt on when you might use certain chart types and encodings.
At first, I exerted more control - using Zod to force the encodings to actual variable names. This turned out to not be necessary. The LLM is great at taking messy input and figuring out which variable you’re talking about. You can ask about cars in the United States, and it will figure out you want to filter the Origin variable to USA. Often, the LLM makes up its own names as aliases in the SQL and uses those.
In a client-side component, I have some logic to take the LLM’s chart specification and render it using Observable Plot. The LLM still has trouble deciding on different charts, but generally does a good job, especially with additional prompting.
Of course, this structured approach limits the LLM’s creativity. Ideally, I wanted to let it generate its own chart code from scratch.
It did a great job generating code, but I as of right now, haven’t found a great way to convert the string that it returns into executable code. I tried using Javascript’s eval() and function constructor, which takes a string argument. However this is a dangerous, some say “evil” function, that can easily crash the application or create a security vulnerability.
Finishing touches with streaming UI
In many ways, it would have been easier to build this app using traditional client-server communication through REST APIs. I could have used Langchain, which is not as easy to integrate into Vercel’s Server Components setup as they make it sound. But I stuck with the server components mainly to test out a key new feature.
It’s called getStreamableUI, and it’s awesome. Instead of streaming just chunks of text, you can stream entire React components. This allows you to build up complex UIs piece by piece, as the LLM returns information.
Here’s what it looks like. As soon as I receive the user message on the server, I immediately render a placeholder card to give instant feedback.
  const reply = createStreamableUI(
    <ResponseCard title={"thinking..."} caption={""}>
      <SkeletonChart />
    </ResponseCard>
  )
Then I run the AI completion. As soon as the LLM comes back with a SQL query, we can update the UI with the query it’s running and the type of chart it plans to make.
 completion.onFunctionCall("summarize_data", async ({ query, chartSpec }) => {
    const { x, y, title, type, color, size } = chartSpec

    reply.update(
      <ResponseCard title={title} caption={query}>
        <SkeletonChart>
          Building {type} chart of {x}, {y}, {color}
        </SkeletonChart>
      </ResponseCard>
    )

    // then start generating the chart

 })
Finally, I actually run the query on the database and render the chart. When the UI is complete, we mark it as done.
 const component =
      type === "table" ? (
        <ResponseCard title={title} caption={query}>
          <Table data={response} xVar={x} />
        </ResponseCard>
      ) : (
        <ResponseCard title={title} caption={query}>
          <Chart
            type={type}
            data={response}
            dataKey={dataKey}
            x={x}
            y={y}
            size={size}
            color={color}
          />
        </ResponseCard>
      )

    reply.done(component)
Finally, I added controls to make corrections when LLM goes wrong, such as flipping the chart, and showing the query. I aim to make data exporting and importing as seamless as possible. You can bring data from a csv or JSON at a URL, or on your computer, and export the LLM’s summaries as csv.
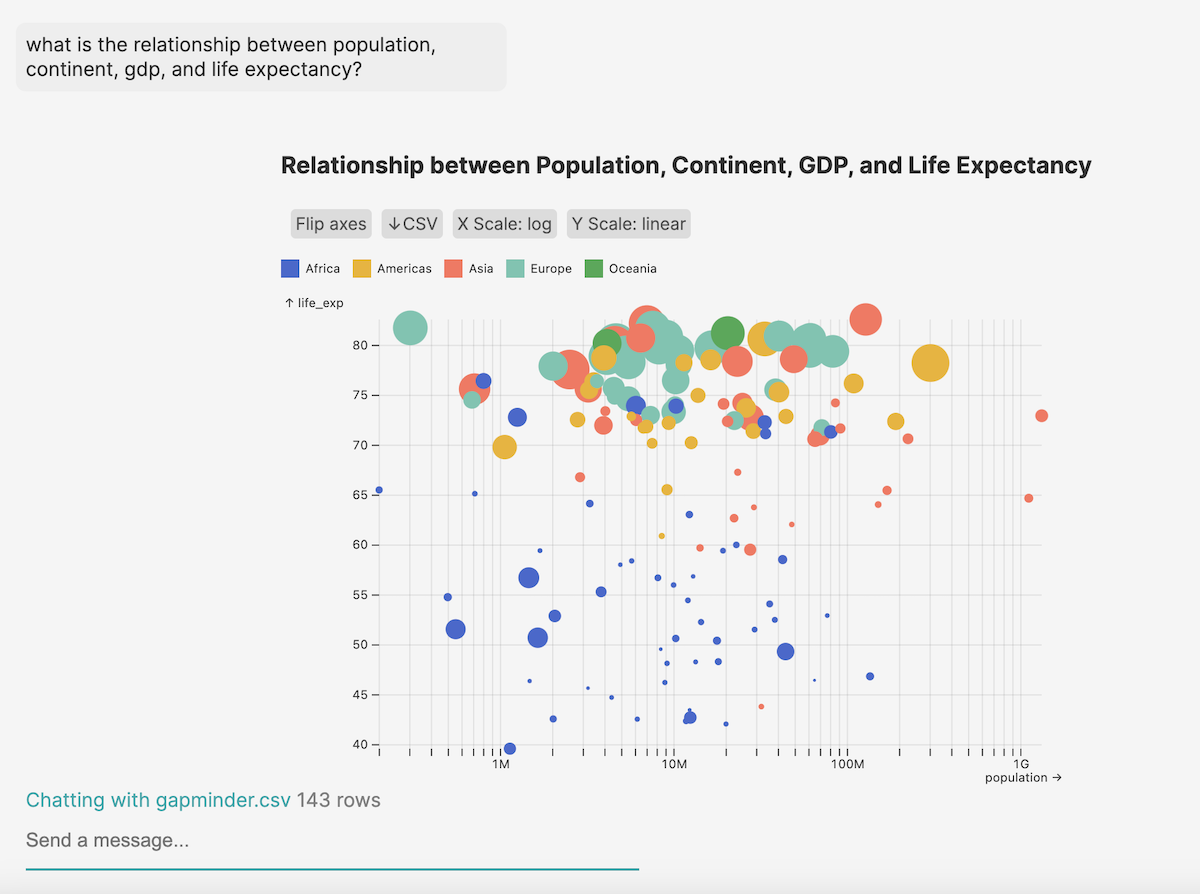
Here’s my attempt to make it produce the famous gapminder chart by Hans Rosling.

…Not quite…but we’re getting there.
Future goals
This is just the beginning. One important feature I hope to implement next is follow-up questions. In the Vercel AI SDK you can keep track of message history in a shared state between AI and the client side, and feed this back into the model prompt on every call.
With the data analysis it’s a bit more complex because I need to direct the LLM to find and use the correct summarized dataset from the last relevant prompt.
In the future, it would be great to allow users to create accounts, save their analyses, and meter their usage of the OpenAI API. Until I implement these features, you can clone the project locally, swap in your own API key, and be up and running.
I’d love to collaborate with others on this. If you’d like to contribute to this project, feel free to tackle an issue in the repo or open a PR for a new feature!